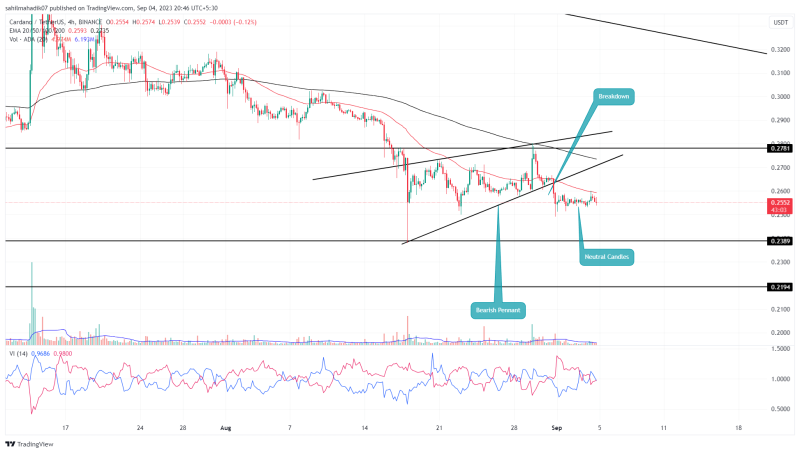
Amid the recent sell-off in the crypto market, the Cardano price showed a bearish breakdown from the support trendline of the inverted flag pattern. This chart setup provides a minor pullback and an opportunity to regain their strength. This breakdown signals the continuation of a downward trend and offers traders the opportunity to short-sell. However, is it enough to go bearish on Cardano?
Also Read: Altcoin of the Week, Cardano (ADA) Showing Rising Onchain Transaction Volume
Neutral Candles disrupt the Anticipated Downfall
- A bearish pennant pattern breakdown set the ADA price for a 6.5% drop
- The downward projects witnessed demand pressure near $0.25
- The intraday trading volume in the ADA coin is $96 Million, indicating a 12% loss
Source- Tradingview
On August 31st, the ADA price experienced a significant drop as it broke below the support trendline of the wedge pattern. This breakdown should have accelerated supply pressure for further downfall, but the sellers’ failure to carry a follow-up indicates weakness in their conviction.
For the past four days, the altcoin price has been sideways creating daily candles with long wicks and short bodies. Despite a significant breakdown, the neutral candles formation reflects uncertainty in the market.
If the sellers are unable to push the prices lower in the coming days, the buyers may take advantage and surge the Cardano coin higher. A breakout from the $0.2667 high of the August 31st breakdown candle will provide bulls with additional confirmation of a bullish reversal.
With sustained buying, the ADA’s market value should be 22.5% to $0.31.

1 ADA to USD = $0.2564377 -0.04% (24h) Buy / Sell


Buy Crypto on an easy to use platform
Invest in leading cryptocurrencies such as Bitcoin, Ethereum, Cardano and more…

ADA

USD
Will ADA Price Fall Back To $0.24?
Contrary to the aforementioned bullish move, if the broader market condition remains bearish, the ADA price will resume the previous downtrend. As the chart setup has already set the potential downfall, the sellers may push the prices to $0.24 support. The support has prevented sellers from extending the downtrend beyond it for the past seven months indicating a high accumulation zone for traders.
- Vortex Indicator(daily): A bearish crossover between the VI+(blue) and VI-(orange) slope reflects the bearish momentum is active.
- Exponential Moving Average(4-hour): The 200 EMA slope acts as strong resistance during minor pullbacks, while the 50-day provides dynamic resistance to buyers.


