The crypto market started September on a negative note, as it followed the steps of the August downtrend. The increasing support has plunged the major digital coin even to a lower level with many of them reaching their monthly or yearly support. In this article, we have picked the crypto coins that retained their bullish setup and hold a high possibility of recovery.
Also Read: US Prez Candidate Ron Desantis Publishes ‘Bitcoin Declaration’
SOL Price Analysis: Wedge Pattern Brings Opportunity of Trend Reversal
Source: Tradingview
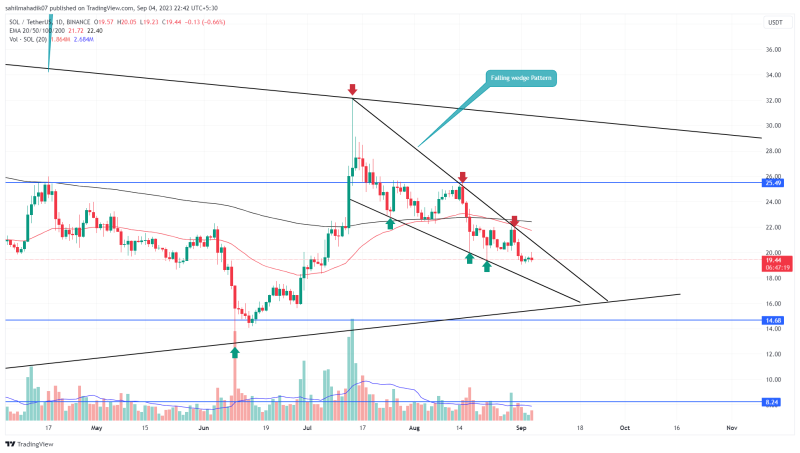
Over the past seven weeks, the Solana (SOL) price has experienced a notable correction, resulting in a falling wedge pattern on its daily chart. This pattern is characterized by converging downward-sloping trendlines, which foretells a potential shift from bearish to bullish sentiment.
Currently trading at $20.37 with a 3.28% intraday loss, the pattern typically leads to a bullish reversal when the price breaks above the upper trendline. Investors observing this setup may anticipate a breakout of overhead resistance, as an opportunity to go long.
The post-breakout rally may surge the SOL price to potential targets of $25.5, followed by $32.
BNB Price Analysis: Trendline Breakout may Increase Buying Pressure

Source: Tradingview.
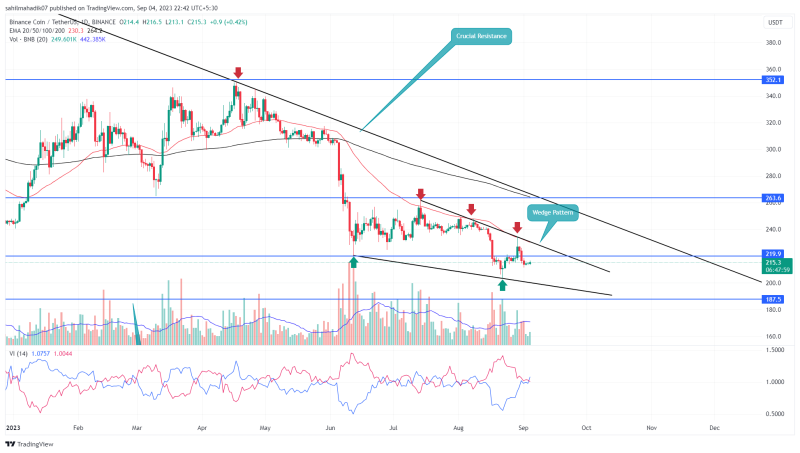
The daily time frame chart shows the falling BNB price has started to converge within two converging trendlines. This narrowing range in a downtrend reflects the weakening bearish momentum and the potential of buyers retaking trendline control.
This pattern is known as a falling wedge/ ending diagonal pattern, suggesting the maturity of a downtrend. By the press time, the coin price trades at $215, and with sustained selling it may plunge to $200 to retest the lower trendline.
The traders looking for an entry opportunity must wait for a breakout above the upper trendline which may lead to a recovery rally to $234, followed by $260.
XRP Price Analysis: Range Breakout May Free $XRP From Uncertainty

Source: Tradingview
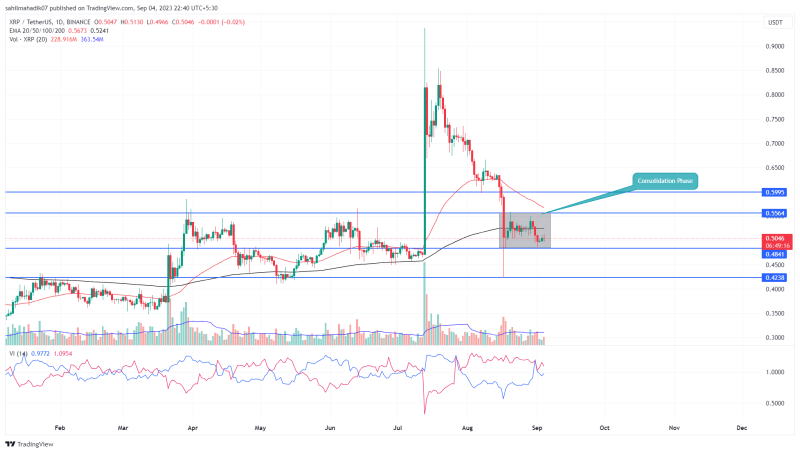
The ongoing correction trend in XRP price has halted at $0.485 support leading to a minor sideways trend in the daily chart. The increasing demand pressure is evidenced by the lower price rejection candle, projecting the buyers are accumulating at lower levels.
This range formation is spread from $0.556 to $0.485 horizontal levels. By the press time, the XRP price trades at $0.5 and continues to wobble between the aforementioned levels.
For the coin price to resume the recovery trend the buyers must breach the upper resistance of $0.55 which may bolster buyers for a rally to $0.6 or $0.665,


