In the last two-three weeks, the broader market trend has witnessed significant bearishness. In response to increasing supply pressure, the well-established crypto stock showed a bearish correction in the technical chart. Here’s how interested traders can benefit from this retracement and obtain these assets at discounted prices.
Also Read: Cathie Wood’s Ark Invest Predicts Bitcoin (BTC) Price Amid Key Macro Events
Coinbase (COIN) Price Analysis: Bullish Pattern Hints Potential Recovery
Source: Tradingview
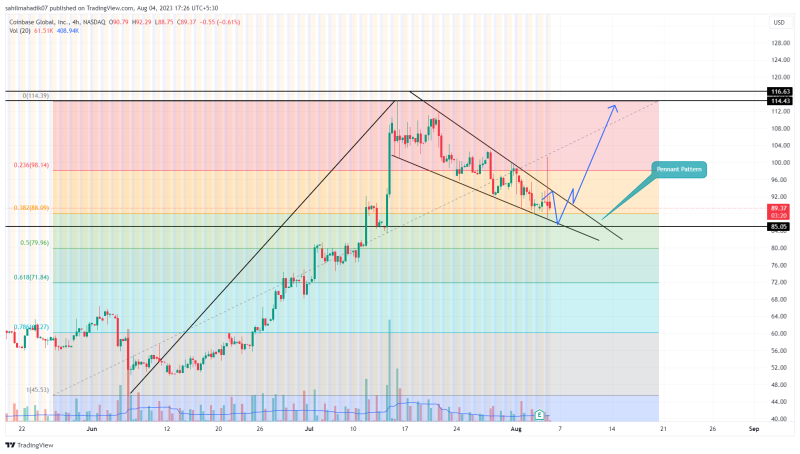
Amid increased supply pressure in the broader market, Coinbase stock price experienced a sharp 22.5% correction from its high of $114.43, currently trading at $90.75. However, a closer look at the 4-hour chart reveals a bullish pennant pattern, indicating a potential continuation of the uptrend.
The stock has rebounded multiple times from the overhead and lower trendlines, highlighting the pattern’s strong influence on market participants. If the support trendline holds, a 3.5% short jump is expected before a potential breakout above the trendline, which could lead to a 26% surge and a rechallenge of the $114.4 price level.
MicroStrategy (MSTR) Price Analysis: Correction Before the Next Leap

Source: Tradingview
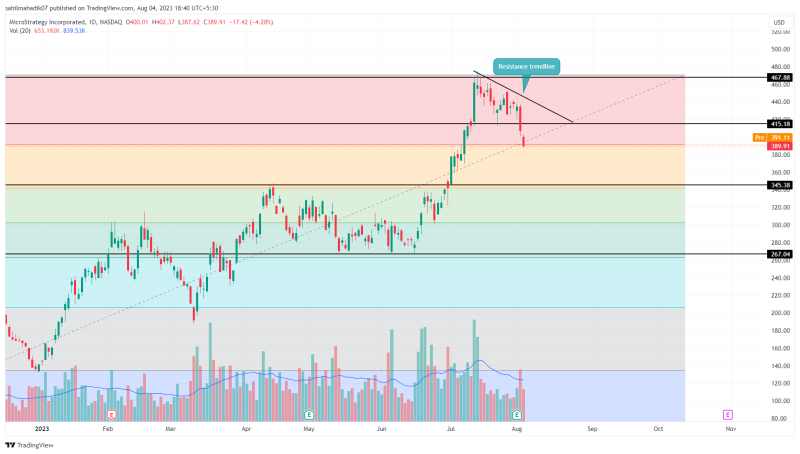
The fast-recovering MicroStrategy stock price experienced a sharp retracement after facing supply pressure at $447.18. The resulting 16.75% fallback in the past two weeks has plunged this MSTR market value to $389.9.
However, as per the Fibonacci retracement level, this asset price is still moving above the 32.8 FIB level, and the overall market trend is still bullish. The 4-hour time frame chart shows a descending trendline carrying the current correction trend.
If the buyers replenished the exhausted bullish momentum, the coin price could break the overhead trendline as a signal of the end of correction. The post-breakout rally could bolster buyers to rechallenge $447.
Grayscale Bitcoin Trust(GBTC): Local Support Bolster Buyers for Bullish Rally

Source: Tradingview
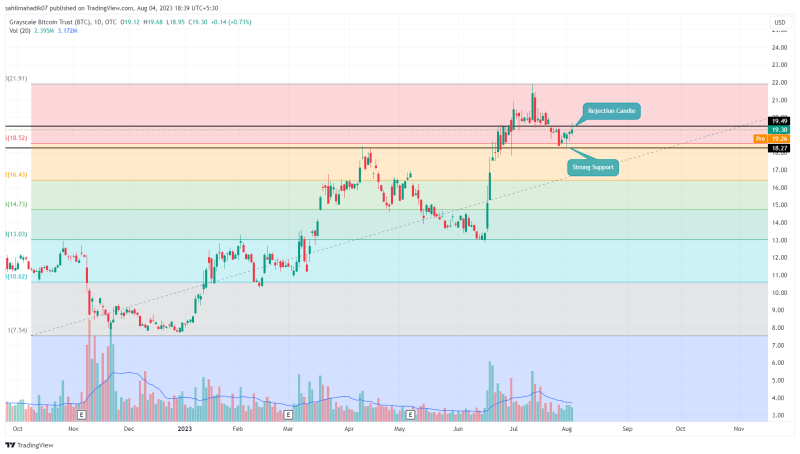
In response to the border market correction, the Grayscale Bitcoin Trust stock price dropped from $21.8 to $18.27 registering a 17% loss. The $18.27 horizontal level aligned with the 23.6% Fibonacci retracement level creates a strong support zone for buyers.
A recovery attempt from this support has offered buyers an opportunity to challenge the nearest resistance of $19.3. However, on August 3rd, the daily chart showed a higher price rejection candle at this aforementioned resistance indicating the overhead supply could bolster a sideways action above $18.27.
If the coin manages to hold this support, the buyers would get more opportunity to break $19.3 and lead a rally back to $21.8.


