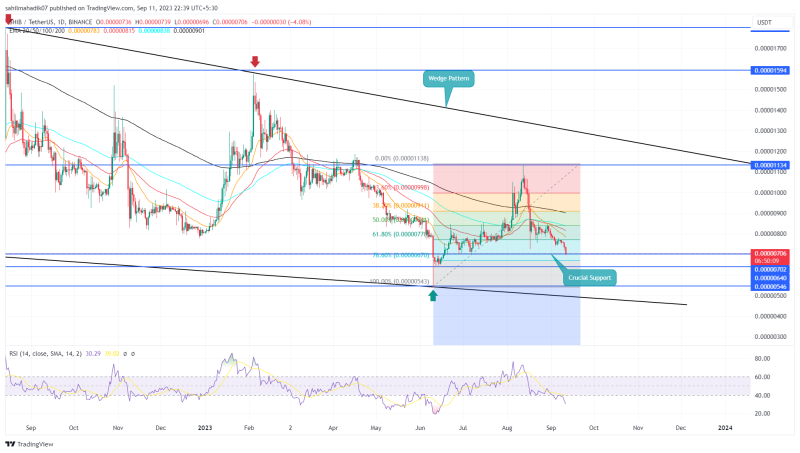
Since the tail end of August, the SHIB price trajectory has been notably downward, plunging from a peak of $0.00000838 to a recent low of $0.0000069. This sharp 16.5% descent, aligned with the broader market bearishness, paints a picture of unwavering SHIB sellers. With the falling price challenge a crucial monthly support, the popular memecoin is under threat for further downfall. Is it time to cut losses and sell?
Also Read: Shiba Inu’s Soaring 323% Burn Rate Captures Investors’ Attention
$0.000007 Support Breakdown Will Trigger a 9% in the Near Term
- The $0.000007 support stands as strong support for crypto buyers
- The dynamic resistance of the 20-day EMA could assist the seller in prolonging the downward trend
- The intraday trading volume of the Shiba Inu coin is $122 Million, showing a 62% gain.
Source- Tradingview
At the time of writing, Shiba Inu price stands at $0.0000072, teetering precariously at the multi-month support of $0.000007. The uptick in volume accompanying this descent underscores the seller’s commitment to a potential prolonged correction phase, especially if it breaches the critical $0.000007 support.
Should the daily candle close below the $0.000007 mark, the sellers would be firmly in the driver’s seat, likely pushing SHIB further into bearish territory. A confirmed breakdown could see Shiba Inu taking another tumble by approximately 9%, targeting the immediate support at $0.0000064.
If this bearish momentum doesn’t wane, SHIB might even find itself at $0.0000054, effectively wiping out all the gains it accrued from June through mid-August.
Here’s How SHIB Price May Trigger a Sustained Recovery
Although the Shiba Inu coin is currently experiencing a bearish trend, it’s important to note that this decline still fits within the confines of an ongoing falling-wedge pattern. If the trend continues, we might see the coin approaching the support trendline of the pattern around $0.000005, presenting a potential opportunity for buyers. That said, a solid recovery for Shiba Inu will likely be confirmed only if there’s a breakout above the pattern’s resistance trendline.
- Exponential Moving Average: The coin price trading below daily EMAs(20, 50, 100, and 200) accentuates the overall trend as bearish
- Relative Strength Index: The RSI slope breakdown below 40% reflects the selling momentum is active.


