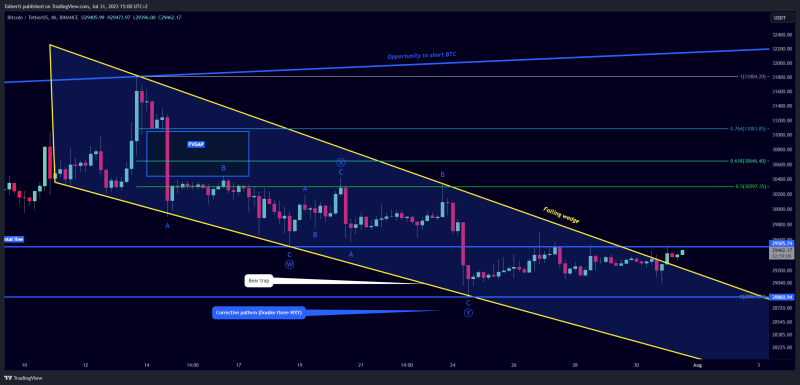
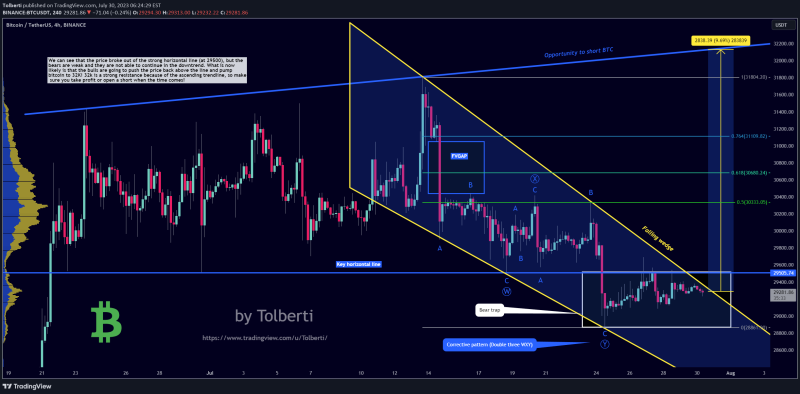
- The price of Bitcoin is currently forming a bullish falling wedge pattern, and we are very close to a breakout! Trade it properly.
- We can see that the price broke out of the strong horizontal line (at 29500), but the bears are weak and they are not able to continue in the downtrend. What is now likely is that the bulls are going to push the price back above the line and pump bitcoin to 32K! 32k is a strong resistance because of the ascending trendline, so make sure you take profit or open a short when the time comes!
- On the way up to 32k, we have some minor resistances, such as the previous unfilled FVGAP and 0.618 FIB retracement. Good for intraday pullbacks, but nothing huge.
- This analysis is not a trade setup; there is no stop-loss, entry point, profit target, expected duration of the trade, risk-to-reward ratio, or timing. I share my trades transparently and post trade setups privately.
- From the Elliott Wave perspective, we clearly see an overlapping structure in the downtrend. I marked it as WXY (double three pattern). Also, the X wave looks like a triangle, which suggests that the downtrend is almost over.
- This is my update on BTC. I expect higher prices for the crypto market in the next few weeks! Alt season is ready, so make sure you buy some altcoins if you haven’t already, as per my previous analysis. Set up notifications for my ideas so you will be alerted in your email when I publish new analyses immediately!
- What do you think about Bitcoin? Let me know in the comment section; I look forward to your opinions!
- Thank you, and for more ideas, hit “Like” and “Follow”!
Comment: +200 likes in a couple of hours? Wow, I don’t know what is going on, but thank you… Comment: We can see that the falling wedge is breaking out! which is definitely good, and I expect a big pump soon…I am long


