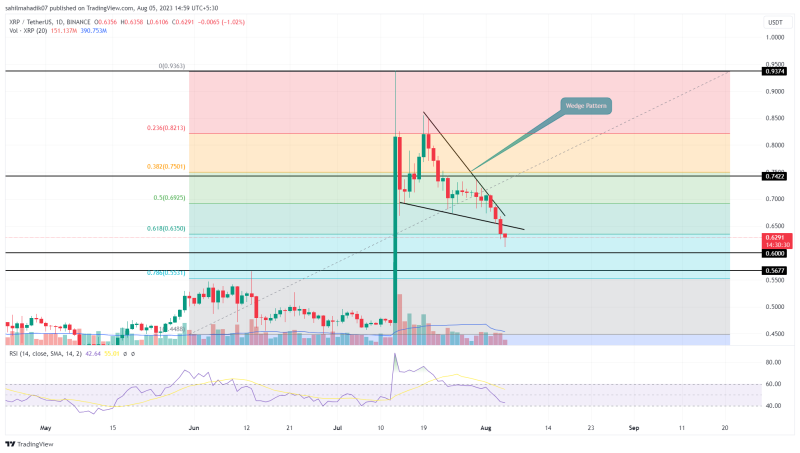
On July 13th, the Ripple coin price experienced an impressive surge of 73% due to a partial victory in the SEC lawsuit, reaching a peak of $0.82. However, after this partial triumph, XRP struggled to keep up the upward momentum, resulting in a double top formation at the $0.82 level and a neckline at $0.70. A recent breakdown from this support triggered extended correction for this altcoin.
Also Read: Ripple Joins Top Global Derivatives Trade Body IDSA
XRP Price Daily Chart:
- A breakdown below the wedge pattern support sets the XRP price for a 15% drop
- The 20-day EMA slope may flip into a suitable resistance
- The intraday trading volume in the XRP is $1.4 Billion, indicating a 17% gain.
Source: Tradingview
The declining XRP prices have formed a bearish wedge pattern on the daily chart. After several days of stability at $0.70, intense selling pressure at the resistance trendline triggered a significant drop in Ripple’s market value.
This downturn represents a 12% decrease over the past four days, with four successive bearish candles. This significant reduction in this altcoin price resulted in the break of the falling wedge pattern and the 38.20% Fibonacci level at $0.64.
At present, the XRP market price is having difficulty maintaining above the 50-day EMA. However, the increase in selling pressure suggests a continued downtrend to the 78.6% Fibonacci level at $0.53. Interestingly, a support zone aligns with this 61.80% fib level, which could increase the chances of a bullish resurgence.

1 XRP to USD = $0.6264946 0.3% (24h) TRADE

XRP

USD
XRP Price to $0.53?
The XRP coin price is anticipated to continue its downward trend, potentially reducing the market value by 15%. However, a bullish turnaround from the 50-day EMA could lead to a retest of the bearish wedge breakout at $0.64. If the coin price shows sustainability below this level, the potential short sellers can enter for a downfall to $0.53.
- Bollinger Band: A downsloping lower band of Bollinger band indicators reflects high momentum selling in the XRP price.
- Relative Strength Index: The falling RSI slope breaks below the midpoint indicating strong underlying bearish momentum


