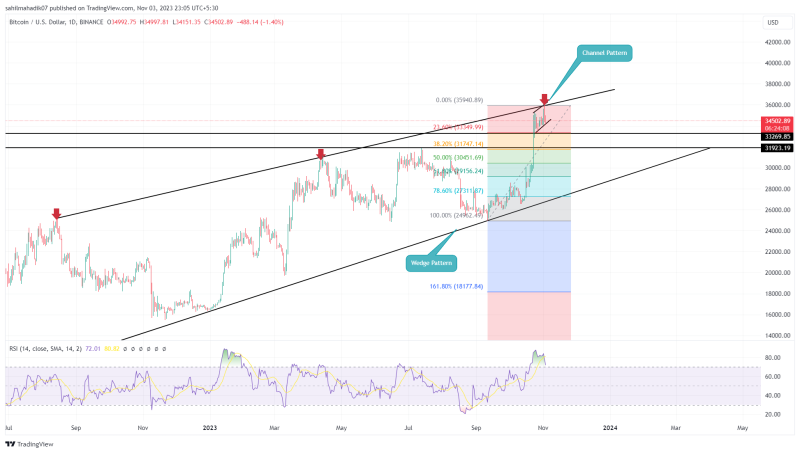
Bitcoin Price Prediction: From the beginning of November, the Bitcoin price faced increased volatility, with resistance around the $36,000 mark causing a pause in its bullish recovery. Over the past two weeks, the coin price has primarily traded sideways, indicating strong selling pressure from above, as evidenced by higher price rejection candles on the daily chart. Could this newfound supply lead to another correction?
ALos Read: Cathie Wood Bets on Bitcoin Amid Market Woes, Know More Here
Chart Pattern Points to Upcoming Correction
- A rising channel pattern is leading the current consolidation trend.
- A breakdown below the channel pattern would set the coin price for a quick 8bi% jump
- The intraday trading volume in Bitcoin is $17.9 Billion, indicating a 28% gain.
Source-Tradingview
Starting from its low point on October 12th at $26,560, the Bitcoin price saw an impressive rally of 35.6%, reaching a 16-month high of $36,000. However, this horizontal level coincides with the resistance timeline of a long-developing wedge pattern, posing a significant challenge for market buyers.
Consequently, market volatility increased, resulting in the formation of several neutral candles on the daily chart. Yet, a closer look at lower time frames reveals this consolidation between two ascending trendlines, forming a rising channel pattern. With this pattern intact, the coin price may continue to move sideways, fluctuating between the $36,000-$35,000 range.
Taking a pessimistic perspective, if sellers manage to break below the pattern’s lower trendline, the BTC price could face a bearish correction in the short term. According to the Fibonacci Retracement Tool, key support levels to watch include $33,270 (aligned with the 23.6% FIB) and $32,000 (aligned with the 38.2% FIB).
A drop to these levels could still be seen as part of a broader bullish momentum for potential recovery above $36,000.
Will BTC Price Drop to $30000?
For over a year, the BTC price has adhered to a bullish trajectory, confined within the structure of a rising wedge pattern. With the recent recovery, the coin’s price has reached the upper trendline, encountering increased selling pressure. Historical data suggests that retesting this upper trendline often leads to accelerated selling pressure, resulting in a correction back to the lower trendline. Therefore, if the pattern continues to play out, the next correction phase in the BTC price could bring it back to the $30,000 mark.
- Relative Strength Index: The daily RSI on the daily chart shows a formation of lower highs in the overbought region, indicating the potential for a price pullback.
- Exponential Moving Averages: The rising 20- and 50-day EMA could offer immediate support to buyers amid the anticipated downturn.


