Contents
Top Altcoins: Bitcoin ETFs experienced a remarkable debut when they started trading on Thursday, January 11. Following their approval, these ETFs rapidly drew in close to $1.5 billion in fresh capital, with around 500,000 transactions in just two days. Eric Balchunas, a senior analyst at Bloomberg shared this information in a recent tweet on January 13th.
BlackRock’s bitcoin ETF emerged as a frontrunner, attracting almost half a billion dollars in capital in its initial two days. Following closely was Fidelity’s ETF, which garnered $422 million in capital inflows. Bitwise secured the third position, drawing $237 million. However, Grayscale faced challenges, with outflows surpassing $579 million, contrasting sharply with the positive inflows seen by most other ETFs.
Despite a successful launch, the underlying asset BTC underperformed creating an uncertain sentiment in the market. While the majority of major coins triggered a new correction, altcoins like Solana (SOL), Toncoin (TON), and Arweave (AR) have shown notable resilience to hold their bullish outlook.
Healthy Market Retracement Sets Solana (SOL) Price to Chase $150
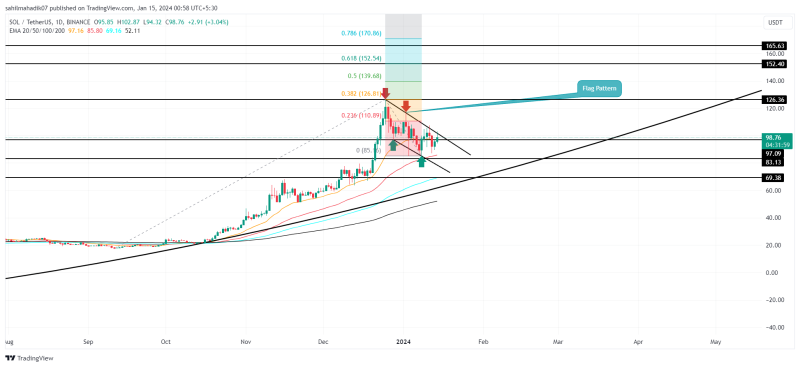
Solana (SOL) Price| TradingView Chart
The fifth largest cryptocurrency Solana has recently experienced a significant downturn amidst broader crypto market volatility. Over the past three weeks, its value dropped by about 22% from a recent high of $126.36, falling to a current price of $98.95.
However, a closer analysis of the daily chart reveals a bullish Flag pattern, suggesting that this decline might be a temporary setback. This pattern, often found during sustained rallies, gives investors a chance to regain momentum.
As of the latest updates, the Solana price has seen a slight recovery, trading at $98.95, which marks a 3.2% increase within the day. Should the price break above the upper trendline of the pattern, it could provide a strong foundation for continued recovery.
According to Fibonacci extension projections, a successful breakout could potentially propel the coin’s price by 58%, targeting a value of around $152.
Moreover, the 50-day EMA is expected to provide ongoing support for pullbacks, aiding buyers in sustaining the upward trend.
Toncoin (TON) Price Poised for 57% Leap Amid Reversal Pattern

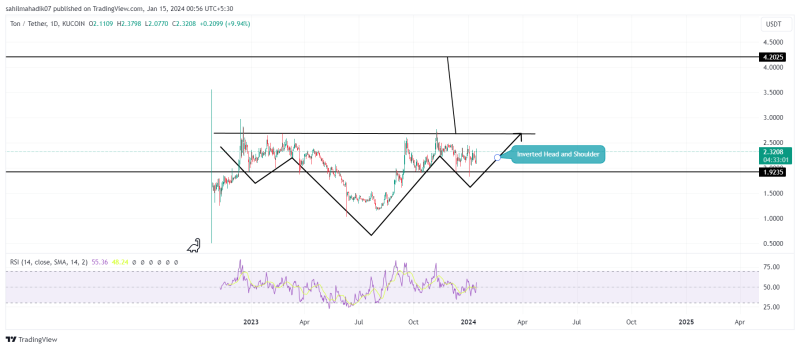
Toncoin (TON) Price| Tradingview
The Toncoin (TON) has demonstrated strong resilience this week, maintaining its position above the $1.92 support. Amidst growing excitement for the first spot Bitcoin ETF launch, the TON price experienced a notable upsurge in buying interest, culminating in a significant 22.4% rise to its current trading price of $2.34.
A detailed analysis of the daily time frame chart for TON reveals the formation of a bullish reversal pattern, known as the inverted head and shoulders. This pattern indicates increased accumulation from market participants and potential for further growth. Driven by this formation, the Toncoin price is anticipated to climb an additional 13.8%, aiming for the neckline resistance at $2.665.
If TON successfully breaches this neckline resistance, it would further solidify the likelihood of a trend reversal. Following such a breakout, the TON value could potentially escalate by 57%, reaching a target of around $4.2.
Moreover, the Relative Strength Index (RSI) maintaining a position above the 50% midline suggests that a recovery trend is actively in progress, adding to the optimistic outlook for TON’s price trajectory
Will the Current Recover Push Arweave (AR) Price to $14?

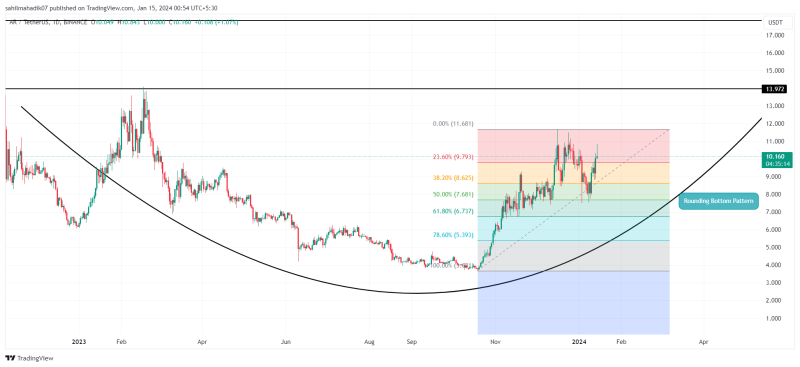
Arweave (AR) Price| TradingView Chart
The Arweave (AR) coin in the daily time frame chart shows the formation of a rounding bottom pattern. This chart pattern commonly spotted at market bottoms indicates increased investor accumulation and the potential for sustained growth.
Amid the recent launch of spot Bitcoin ETF, the AR price showed a strong bounce back from combined support of $7.65 and 50% Fibonacci retracement level. This healthy retracement and renewed buying interest surge the coin price by 35.48% to currently trade at $10.2.
Under the influence of this pattern, the Arweave price could surge another 36.5% to hit the pattern’s neckline resistance at $14.
A bullish breakout from the neckline resistance would provide a better confirmation for a trend reversal. Additionally, a bullish crossover state between the MACD (blue) and the signal (orange) lines suggests that buyers are the dominant force in the market.
Related Articles:
- Michael Saylor Delivers Crucial Warning Amid Spot Bitcoin ETF Debut
- Miller Value CFA Advocates MicroStrategy Stock Over Bitcoin ETF
- Grayscale Transfers $900M in BTC Amid ETF Speculation


