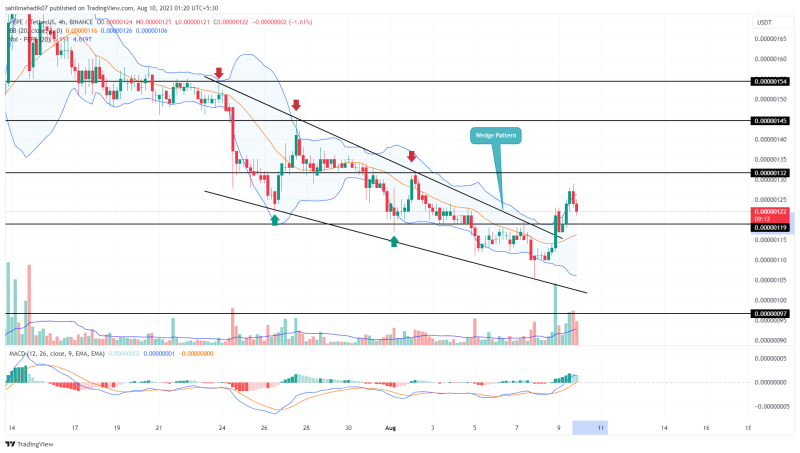
Pepepcoin Price Analysis: Amid the ongoing correction in the Frog-themed cryptocurrency PEPE, the coin price is shaped into a falling wedge pattern or also known as an ending diagonal pattern. The converging trendline of this pattern, where the support trendline is less inclined indicates the weakening bearish momentum. Here’s how a bullish breakout from this pattern leads to a potential rally in Pepecoin.
Also Read: Pepecoin Price Rally to $0.0000015? Chart Pattern Signals End of Correction
Pepecoin Price Daily Chart
- An upside breakout from the wedge pattern could set the PEPE price for a 25.5% rally
- The MACD indicator slope above the midline could offer additional confirmation for the price rally.
- The 24-hour trading volume in the Pepecoin coin is $59.9 Million, indicating a 47.5 % loss.
Source- Tradingview
The formation of the ending diagonal pattern is often a sign of trend maturity and triggers a significant counter-trend move. After spending nearly two weeks within the pattern the Pepe price gave a bullish breakout from its upper resistance on August 8th.
This breakout back by increased volume indicates the conviction of buyers to lead a higher recovery. So far the post reset really has such a coin price of 4.86% to reach the current trading price of $0.0000012
Completion of this chart pattern leads to a rally back to where it started. Therefore, With sustained buying the PEPE price is likely to be 25.5% higher to hit $0.00000154.
What are the Potential Targets for PEPE Price Rally.?
After a significant breakout of the pattern’s resistance trendline, the market participants can expect each swing high as a potential target. Thus, the post-breakout rally could hit $0.00000132, followed by $0.00000145, and $0.00000154.
- Bollinger Band: An uptick in the upper ceiling of the Bollinger Band indicator reflects the police momentum is aggressive.
- Moving average convergence divergence: a positive crossover state between the MACD(blue) and signal(Orange) line indicates the short term has turned bullish.


