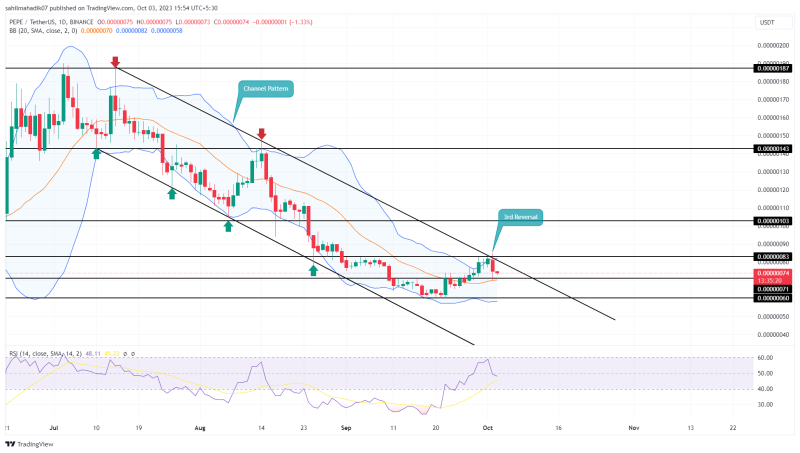
In the final weeks of September, the PEPE price staged an impressive recovery, erasing all earlier losses from the first half of the month. The price surged from $0.0000006 to $0.00000083, marking a substantial 37.5% gain. However, this rally met a significant obstacle at a dual resistance level, consisting of the $0.00000083 price point and the upper trendline of a channel pattern. The question is whether the current bullish sentiment can help buyers overcome this hurdle.
Also Read: Is Pepecoin Worth The Hype
Will the PEPE Price Fall Back to $0.0000006
- The high supply pressure at $0.0000083 pushed the PEPE price lower.
- A falling channel pattern continues to pressure this memecoin for a more prolonged correction trend.
- The 24-hour trading volume in the Pepe coin is $79.2 Million, indicating a 1% loss.
Source: Tradingview
On October 2nd, the Pepe coin price action showed a strong bearish engulfing candle at the resistance trendline of the channel pattern. This candle, which eclipsed the preceding three days of trading, could be an early warning signal for a potential bearish reversal.
Currently trading at $0.00000074 at the time of this analysis, and experiencing an intraday loss of 1.33%, the asset could be poised for a downward trajectory. A breach below yesterday’s low of $0.000000107 would provide the market with additional confirmation for an impending correction.
This could potentially trigger a 14% slide to retest the last swing low at $0.0000006, and possibly extend the downtrend even further should selling pressure continue to mount.
PEPE vs DOGE vs SHIB Performance

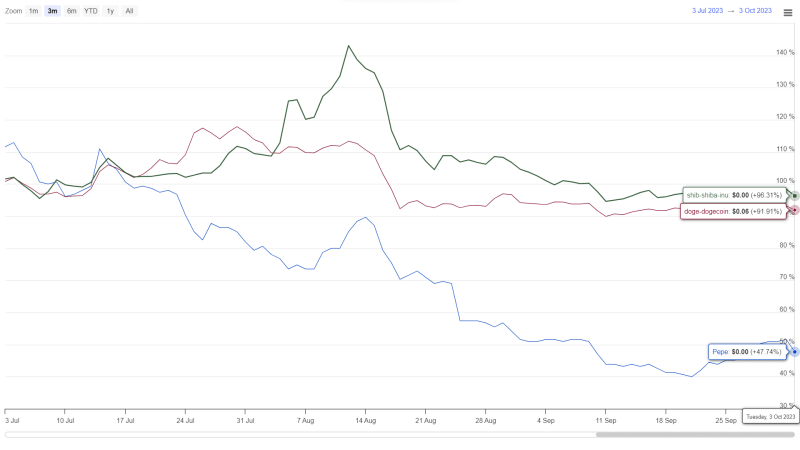
Source: Coingape| Pepe coin Vs Dogecoin Vs Shiba Inu Price
When comparing the price action over the last three months, the Pepe Coin has displayed higher volatility than the Dog-theme meme coins like SHIB and Doge. While Pepe Coin has been in a consistent downtrend, both Shiba Inu price and Dogecoin price have exhibited more sideways movements in their mid-term trends.
- Bollinger Bands: The flattening of the upper Bollinger Band suggests it could act as an additional resistance level, further challenging bullish attempts.
- Relative Strength Index: The daily RSI dipping below the 60% level implies that a managed reversal is increasingly likely, providing another cautionary signal for traders bullish on memecoin.


