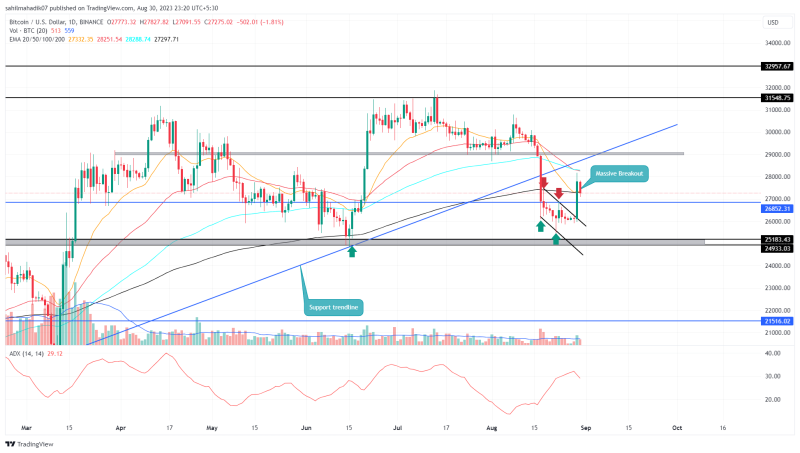
On 29th August, the BTC price broke free from two weeks of indecisive movement created within two downsloping trendlines. Today, the BTC price witnessed a massive inflow in response to a federal court verdict in favor of Grayscale over the U.S. Securities and Exchange Commission (SEC) for Bitcoin ETF. The bullish jump reclaimed the $27000 mark offering a suitable launchpad for further gain.
Also Read: Grayscale Victory: Expert Reveals What Comes Next for Bitcoin ETF
Bitcoin Daily Chart: Key Points
- The bullish engulfing candle enveloped the last two weeks’ price action, indicating a significant candle for buyers to counterattack
- A potential breakout above $29000 could set BTC up for a higher rally
- The intraday trading volume in Bitcoin is $21.9 Billion, indicating a 7% loss.
Source- Tradingview
The August 29th bullish candle recorded a 6.35% gain and reached a high of $28180. This price jump offered a high momentum breakout of the immediate barrier of $27000 and also reclaimed the 200-day EMA.
However, the Bitcoin price did not offer a follow-up candle and showed a 1.8% intraday fall. If this minor pullback is sustained above the 200-day EMAs or $27000 the buyers will drive the bullish bounce 6.3% higher to reach the $29000 barrier.
The aforementioned barrier aligned with the high of the August 17th sell-off candle indicates the coin holders may witness an intense supply zone at this level. Therefore, the buyers must break above this resistance to get a suitable confirmation of price recovery.

1 BTC to USD = $27237.287 -0.66% (24h) Buy / Sell


Buy Crypto on an easy to use platform
Invest in leading cryptocurrencies such as Bitcoin, Ethereum, Cardano and more…

BTC

USD
Can BTC Price Fall Below $25000?
A keen look at the daily time frame chart shows the anticipated upswing in Bitcoin price could be a minor retest to the recently breached channel pattern on August 17th. The pullback may recuperate the exhausted selling momentum at $29000 to prolong the downtrend even below the $25000 psychological level. Therefore, the crypto holder must keep a close watch on the price behavior at overhead resistance.
- Average Directional Index: A downtick in the daily ADX slope reflects the weaknesses of prevailing bearish momentum and a higher possibility of bullish recovery.
- Exponential Moving Average: The recently reclaimed 50-and-200-day EMA can offer strong support for Bitcoin recovery.


