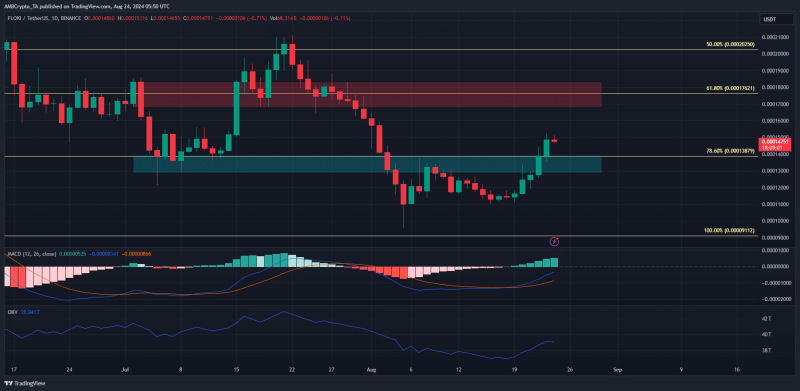
The MACD, though below zero, formed a bullish crossover and signaled that the downward momentum was swiftly losing its grip.
Edited By: Jibin Mathew George
- The bullish market structure and buying pressure could see FLOKI extend its rally
- Liquidation data showed that a price dip was likely
The recovery attempt has been relatively strong for Floki Inu [FLOKI]. Since the steep drop on 5 August, FLOKI is now up close to 52%, compared to Bitcoin’s [BTC] 31%. Additionally, FLOKI also imposed a bullish market structure on the 1-day timeframe.
This could pave the way for the memecoin to reclaim its levels before the late July price drops began. At the time of writing, a 20% move higher on appeared likely.
Daily close encourages another move higher

The price action on the 1-day chart was bullish after the recent move beyond $0.00014. Retesting the $0.000138 region as support would present a buying opportunity targeting $0.000176, the next significant resistance.
The MACD, though below zero, formed a bullish crossover and signaled that the downward momentum was swiftly losing its grip. The OBV climbed higher over the past week, but was not close to the late July highs.
Here, it should be noted that FLOKI has appeared to break the downtrend on the daily timeframe, but ultimately was forced to fall. The most recent example occurred on 21 July, when a local resistance zone was breached but the buyers were unable to defend it.
FLOKI liquidity levels show strong bullish bias

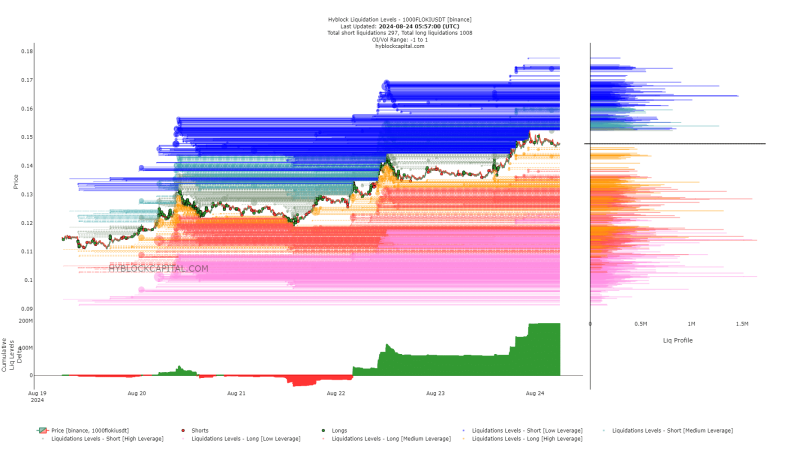
The cumulative liq levels delta was intensely positive to indicate a major difference between long and short liquidation levels in recent days. This bullish expectation could see the long positions squeezed, although this may not be guaranteed in any way.

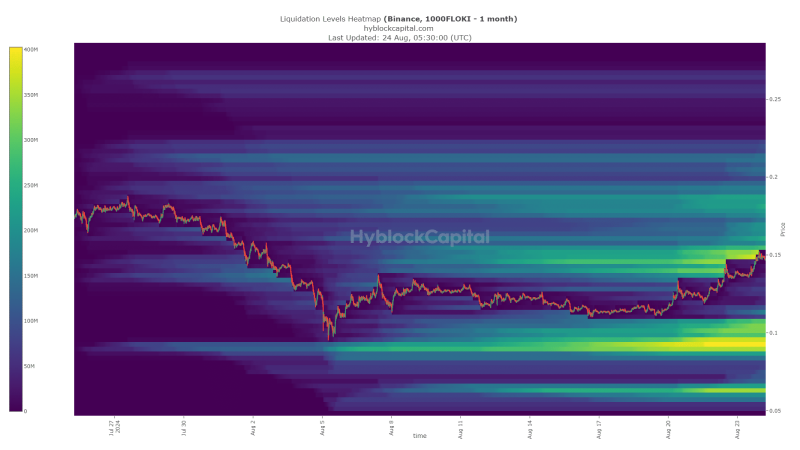
The liquidation heatmap gave another reason for bearish expectations. The $0.00015 pocket was the key liquidity cluster to the north and seemed to have been swept over the last 24 hours.
Realistic or not, here’s FLOKI’s market cap in BTC’s terms
There is more liquidity higher but traders can also be wary of a bearish short-term reversal. A sustained fall below $0.000128 would signal that $0.0001 is the next target.
Disclaimer: The information presented does not constitute financial, investment, trading, or other types of advice and is solely the writer’s opinion


