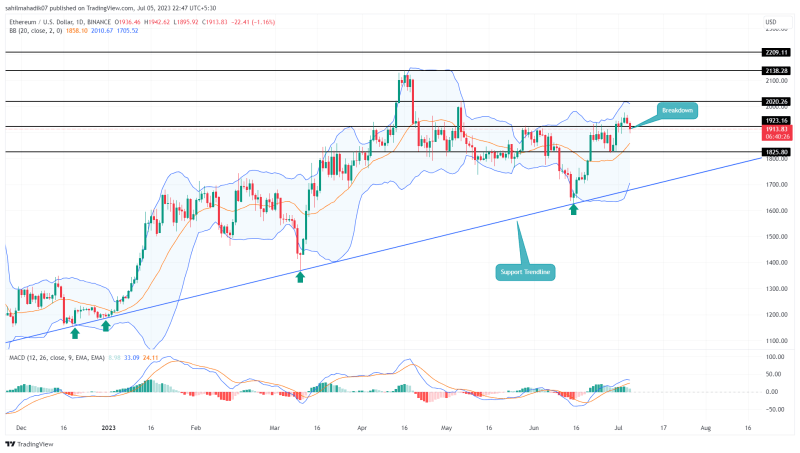
Amid the recent recovery in the crypto market, the Ethereum price gave a strong breakout from the monthly resistance of $1922. In the last four days, the buyers tried to sustain this level but witnessed today as the prices dropped below the breached level. This scenario creates a bull trap which is known to intensify selling pressure and plunge the asset price back to lower levels.
Also Read: Ethereum Births New Token Standard, Will This Reduce ETH Supply?
Ethereum Price Daily Chart
- A breakdown below the $1922 mark sets the ETH price for a quick 4.3% drop
- The Ethereum price could maintain a bullish outlook until the rising trendline is intact.
- The intraday trading volume in Ether is $6.9 Billion, indicating a 10% gain.
Source- Tradingview
With an intraday loss of 1.75%, the Ethereum price showcased a breakdown below the $1922 flipped support. This breakdown undermined the buyer’s last weekend attempt to reclaim this level as a stepping stone to prolong this recovery.
By the press time, the ETH price trades at $1907, and if the daily candle closes below the $1900 mark, the sellers will gain significant confirmation to carry a downfall. With sustained selling, the aggressive buyers who entered $1922 may get liquidated and bring more selling orders.
The potential fall could tumble this altcoin’s value by 4.3% before hitting the next strong support at $1825.
On a contrary note, if the daily candle rise above the $1922 mark by the day’s end, the bearish thesis will be invalidated.
Has Ethereum Recovery Ended?
If the selling momentum rises and triggers a significant correction, the Ethereum price will revisit a long-coming support trendline. This dynamic support has maintained a steady recovery for the past seven months and offered suitable pullback support to accumulate at dips. Thus, until this trendline is intact, the ETH price may prolong an upward rally.
- Bollinger Band: A downtick in the upper band of Bollinger band indicators reflects the exhausted bullish momentum.
- Moving Average Convergence Divergence: The MACD(Blue) and signal(orange) line gradually closing towards a bearish crossover could increase beard trend sentiment among market participants.


