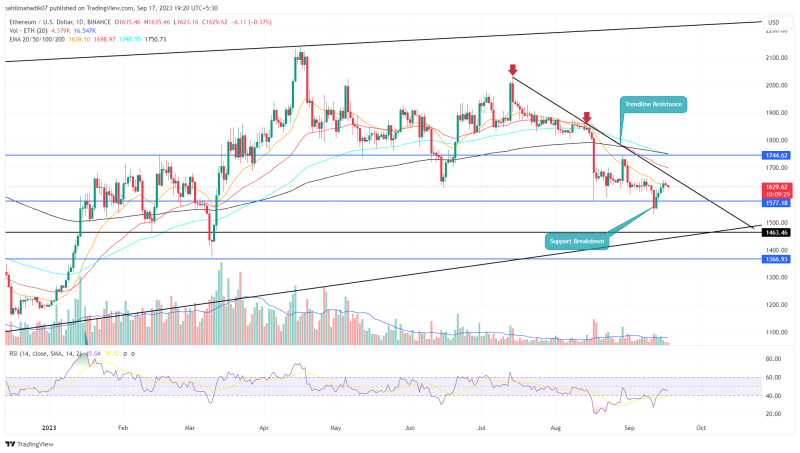
On September 11th, the Ethereum price chart showcased a high momentum breakdown from the $1,577 support. Such a move would typically hint at the continuation of bearishness, but, with the recent upsurge of buying pressures across the crypto spectrum, the sellers found themselves caught off-guard. Unable to push the price downward substantially, a rapid reversal became evident on the daily price chart. This momentum has driven the ETH price upwards by approximately 6.5% over the past week, settling it at its current trading price of $1,631. Such instances, commonly termed ‘bear traps’, can be a precursor to amplified buying pressures, and assist buyers in a sustained recovery.
Also Read: Friend Tech Outranks Tron and Ethereum in Daily Earnings
Will ETH Price Breaks Below $1600?
- The ETH price could witness intense supply pressure at the downsloping resistance trendline
- A bearish crossover between the 100-and-200-day EMA should bolster the continuation prevailing downtrend
- The intraday trading volume in Ether is $2.6 Billion, indicating a 34% loss.
Source- Tradingview
In the intraday trading scenario, the Ether price has experienced a modest 0.22% pullback, mildly dampening its prevailing relief rally. However, if the ongoing bullish sentiment remains resilient, the coin price may see a potential increase of around 2%, positioning it to confront the impending overhead resistance trendline.
This downsloping trendline is carrying the ongoing correction trend and has proven its mettle by repelling buyers’ advances twice over the past two months. If traders encounter augmented selling pressures at this pivotal junction, we might witness the Ethereum price retracing its steps, instigating a 10% decline to the $1,468 mark.
However, the aforementioned support level converged with a longstanding support trendline, which has underpinned altcoin’s upward journey since June 2022. If this support boundary withstands potential selling pressures, it would serve as an enticing entry point for prospective investors eyeing market dips.

1 ETH to USD = $1635.976 0.23% (24h) Buy / Sell


Buy Crypto on an easy to use platform
Invest in leading cryptocurrencies such as Bitcoin, Ethereum, Cardano and more…

ETH

USD
BTC vs ETH Performance

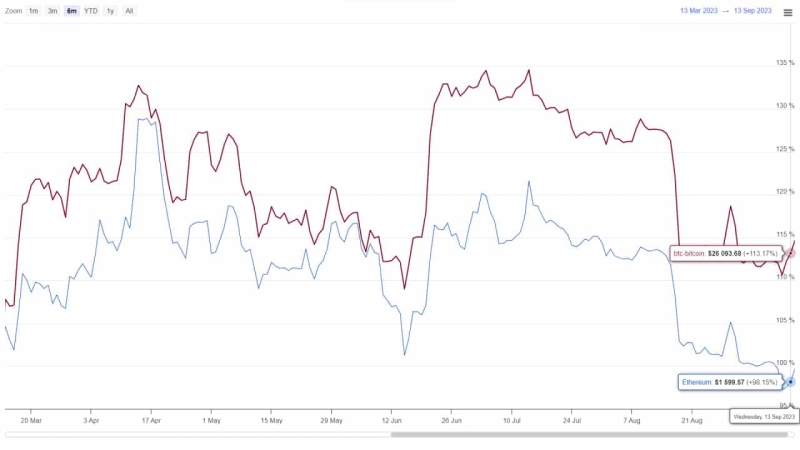
Source- Coingape
Over the past six months, when examining the Bitcoin price ($26,544) in comparison to the Ethereum coin, it’s evident that the ETH price experienced a sharper decline during the second week of September. This downturn also breached the last swing low support of $1630, violating the uptrend definition as per dow theory.
In contrast, Bitcoin has more effectively maintained its recovery trajectory, with buyers keeping the price above the recent swing low of $24,840.
- Exponential Moving Average: The 50-day EMA running concurrently with the descending trendline strengthens the resistance offered by this boundary.
- Relative Strength Index: The daily RSI slope’s upward trajectory surpassing the 40% level indicates buyers’ efforts to break the prevailing trendline overhead.


