DOGE recently climbed to a one-month high, plunging short traders into losses.
- During the trading session on 4 July, DOGE exchanged hands at a one-month high.
- Its Bollinger Bands and Chaikin Money Flow indicators hinted at a potential price drawback.
For the first time in almost four weeks, Dogecoin [DOGE] reclaimed the $0.07 price mark during the intraday trading session on 4 July, data from Santiment revealed.
Read Dogecoin’s [DOGE] Price Prediction 2023-2024
According to the on-chain data provider, the intraday surge in the memecoin’s value came after several short positions were opened toward the end of last week. For example, on leading exchange Binance, DOGE’s funding rates touched a low of 0.0323% on 29 June, highlighting how much traders banked on the DOGE’s price to fall.
With a rally in DOGE’s trading volume and a corresponding growth in its price in the last 24 hours, data from Coinglass revealed that $808.01k short positions were liquidated during that period.
If you are looking to dodge losses…
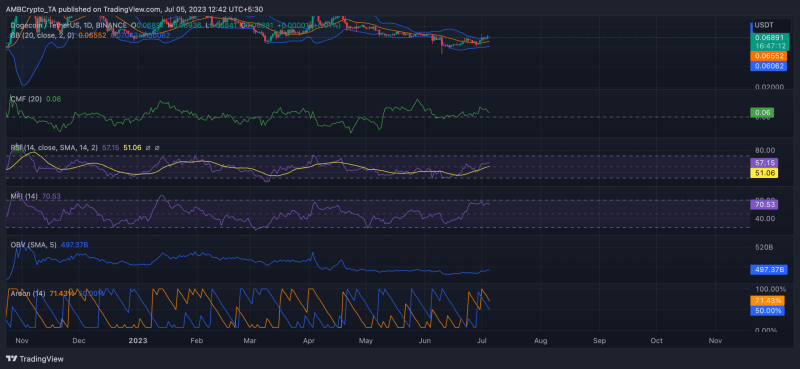
While short traders placed bets against DOGE on 29 June, the rest of the market intensified accumulation. An assessment of DOGE’s key momentum indicators revealed this. The coin’s Relative Strength Index trended upwards from 29 June to 57.15 at the time of writing. Likewise, DOGE’s Money Flow Index was spotted close to the overbought territory at 70.53.
Further, DOGE’s On-balance volume climbed by almost 2% in the last week. When a coin’s OBV grows in this manner, it suggests that the volume of buying pressure is increasing. This growth in demand for the coin often leads to upward price movement, as is the case here.
Confirming that DOGE’S current high was reached recently, its Aroon Up Line (orange) returned a value of 71.43% at press time. When the Aroon Up line of an asset is close to 100, it indicates that the uptrend is strong. And that the most recent high was clocked relatively recently.
Some indicators tell a different story
The above indicators suggested that the leading memecoin was well positioned for a continued price rally. However, a closer look at its Bollinger Bands and Chaikin Money Flow revealed that a price correction might be underway.
At the time of writing, DOGE’s price was positioned above the upper band of its BB indicator. When an asset’s price is found in this manner, it means the asset is potentially overbought or experiencing a period of high volatility.
How much are 1,10,100 DOGEs worth today?
It is taken by traders and investors to mean that the asset is potentially overextended and that selling pressure may increase. This could lead to a price decline or a reversion toward the middle band.
As for its CMF, this trended downwards despite the growth in DOGE’s value in the last week. This created a bearish divergence that often precedes a price decline.


