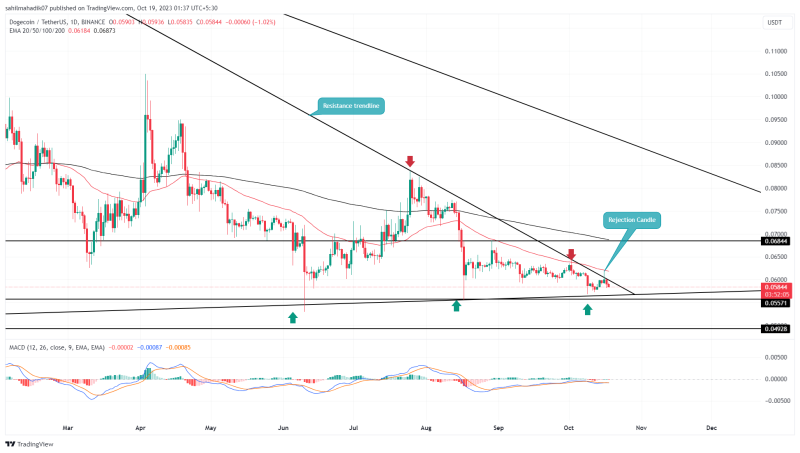
Amid a recent surge in the broader crypto market, the DOGE price attempted a notable breakout from a year-long, downward-sloping trendline that has been guiding its correction. However, the failure to maintain levels above this breached barrier led to a price reversal, indicating that overhead supply pressure remains strong, as does the ongoing correction.
Also Read: Shiba Inu And Dogecoin Get Listed On BitTrade, Price To Rally?
Will the Recovery Trend Continue?
- The Dogecoin price getting squeezed into a narrow range could lead to a decisive breakout
- An upside breakout from the resistance trendline could trigger a fresh rally
- The 24-hour trading volume in Dogecoin is $113 Million, indicating a 30% loss.
Source-Tradingview
On October 16th, the Dogecoin price experienced its fifth rejection from a long-standing resistance trendline. The daily candle that formed during this failed breakout exhibited a high wick, suggesting an aggressive overhead supply.
Historically, reversals following such patterns have often resulted in significant corrections. Consequently, the DOGE price has been on a downturn for the past two days, registering a 2.5% decline.
If the selling pressure persists, the coin price is likely to drop an additional 4-5%, potentially retesting the yearly support trendline at around $0.055. Currently, this memecoin’s price is wedged between these two significant trendlines, signaling that a decisive breakout—or breakdown—is imminent.
If the coin manages to sustain a breakout above the resistance trendline, we could witness a sharp 16.8% surge, targeting the $0.068 level
Will DOGE Price Sustain $0.055 Support?
On the daily time frame chart, an ascending support trendline has cushioned Dogecoin buyers during significant market downturns over the past 2.5 years. This support level has acted as a strong accumulation zone, thereby shielding coin holders from major market dips. A reversal or breakdown from this crucial level warrants close attention from investors. Taking a pessimistic view, a breach below this support could catalyze a major correction for Dogecoin.
- Moving Average Convergence Divergence: The MACD(blue) and (signal)orange slope showing multiple crossovers near the midline indicate a neutral sentiment among traders.
- Exponential Moving Average: The 50-day EMA slope continues to act as major resistance.


