BTC price dropped below $30,000 again on July 18, but the recent crab market price action is also backed by compelling investor activity on-chain.
Bitcoin (BTC) price dropped below the $30,000 level on July 18, which retail investors may not have expected given the developments of the last month, but does the downside move represent an upcoming shift in the trend?
Data suggests that over the longer term, it does not.
To get to the positives first, Bitcoin price is still attempting to flip the $30,000 level to support after about 10 attempts since April of this year, but price is continuously finding buyers in the $28,000 to $25,000 range, which buyers seem to be viewing as an accumulation zone.
On-chain data from Glassnode’s Bitcoin Accumulation Trend Score supports this sentiment and could be a positive, depending on how investors’ look at things given that the behavior of investors at $30,000 BTC price mirrors the same accumulation behavior seen in the $28,000 to $24,000 zone and the near the supposed $16,800 bottom.
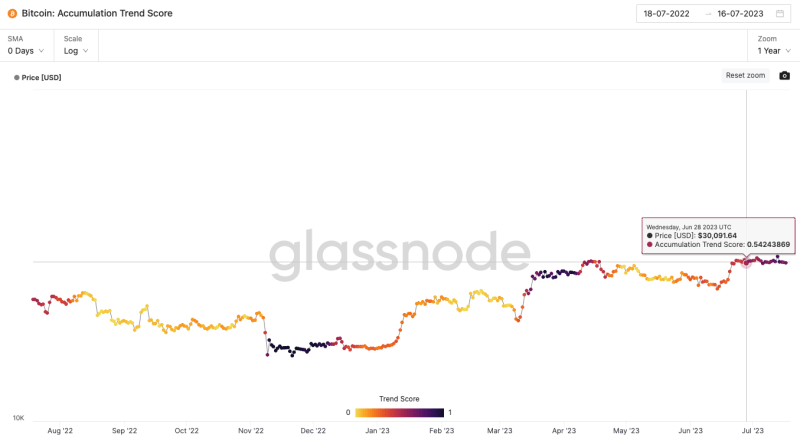
According to Glassnode, “an Accumulation Trend Score of closer to 1 indicates that on aggregate, larger entities (or a big part of the network) are accumulating, and a value closer to 0 indicates they are distributing or not accumulating.”
Basically, buyers strongly accumulated from November to December and they were heavy accumulators from March to April when BTC recaptured $30,000. The metric suggests they are doing the same in July as BTC attempts to either conquer the $30,000 resistance or received a boost from all the ETF and XRP SEC news.
Bitcoin is in a crab market
The current price action and derivatives market data suggest that Bitcoin is in a crab market, where price remains range bound and consolidates for a prolonged period of time. As JLabs analyst JJ the Janitor pointed out last week, a strong push through the $32,000 level would catalyze a CME gap fill from the Luna Terra-crash era.
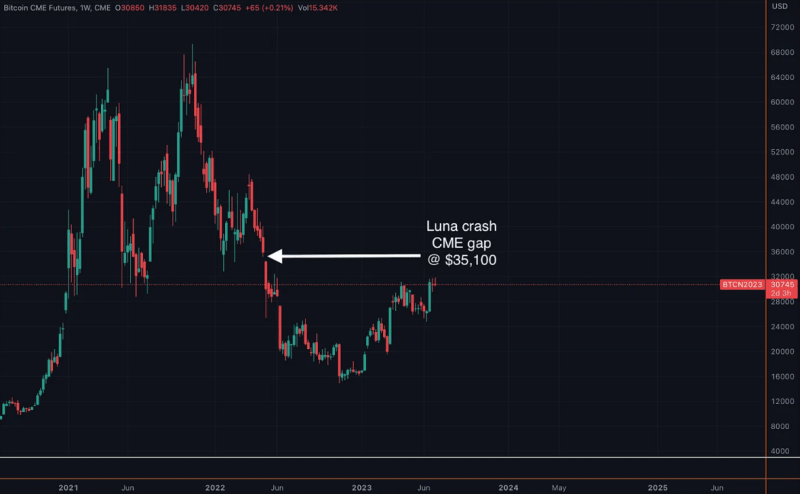
From the perspective of Bitcoin’s weekly market structure, the $30,000 level is an important pivot point that has functioned as support in the previous bull market cycle (and now as resistance) but a grab above that level would essentially set a higher high on the longer time frame and be confirmation of a trend reversal where the next point of resistance is around the $37,000 level.
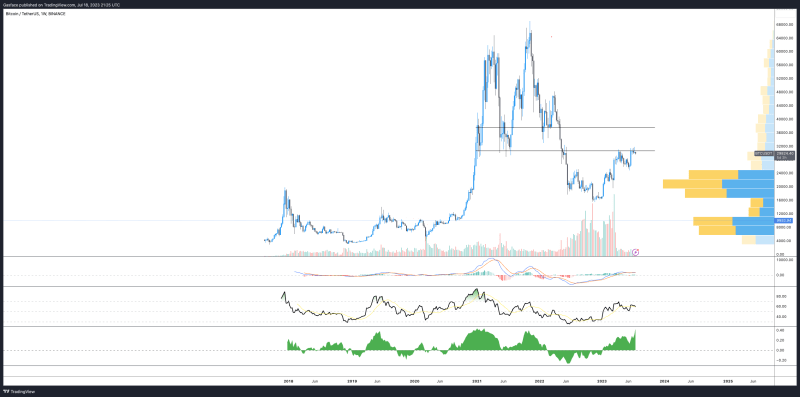
Traders’ activity in the derivatives market is another factor contributing to the current crab market. Funding is down, open interest is relatively muted and besides retail plebs who are attempting to long breakouts and long lower support retests, or short breakouts and getting liquidated in both instances, a meaningful surge in these metrics that would inspire confidence that price is on the verge of some massive breakout has yet to emerge.
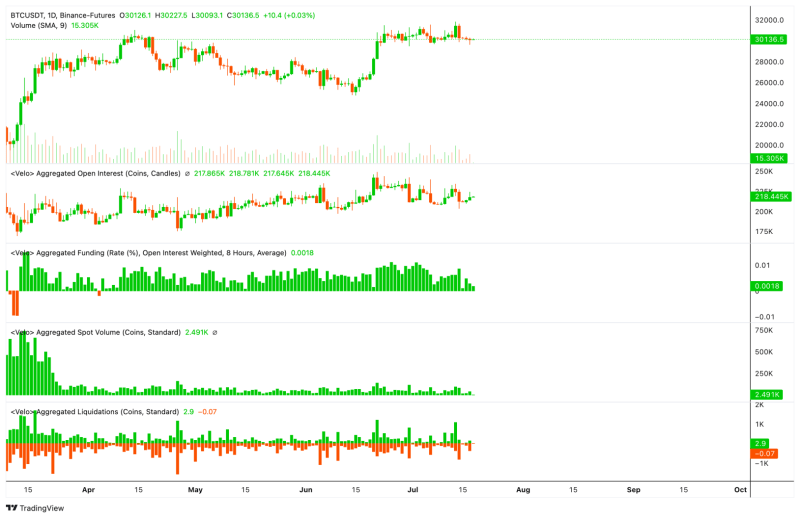
Sure, DXY took a dip below 100 last week, but it’s possibly more connected to investors reacting to the Fed’s positive steps on inflation and too tight of a timeframe to expect some massive reaction from BTC immediately.
The price action in crypto exchange futures highlights degen longs and shorts trying to get ahead of price breakouts and that they are not having much success in the short term.
JJ the Janitor suggests that a metric to watch is aggregate open interest, if that breaks down sharply from the current range then some true buy the dip opportunities could emerge. Currently, it’s still in an uptrend, albeit sideways, but seeing a surge in OI could also be interesting and likely news, regulatory or legislative event driven.
While Bitcoin’s short-term price action might raise some concern among newer investors and day-traders, the on-chain perspective remains quite compelling.
The #Bitcoin Long-Term Holder Supply remains at an ATH of 14.5M BTC. This suggests mature investors are preferring to accumulate Bitcoin, rather than distribute. pic.twitter.com/VkY9uTAVGG
— glassnode (@glassnode) July 18, 2023
At the same time, the Total Balance in Accumulation Addresses metric has also resumed its uptrend since March 16, when BTC price traded at $25,000.
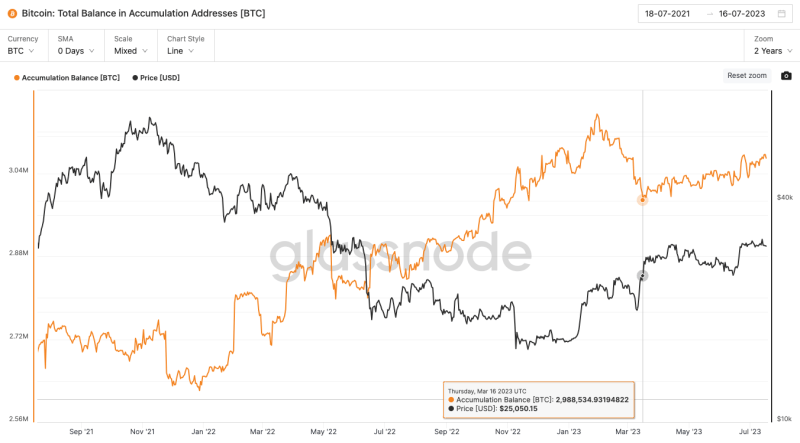
Readers should also note that the metric also shows the total balance in accumulation addresses increasing since January 2022, when Bitcoin price was trading at $47,800 per coin. What is apparent is that through the worst of the crypto market collapse and Bitcoin price sell-off, multiple on-chain metrics show investors continuing to increase their allocation to BTC.
This article does not contain investment advice or recommendations. Every investment and trading move involves risk, and readers should conduct their own research when making a decision.

