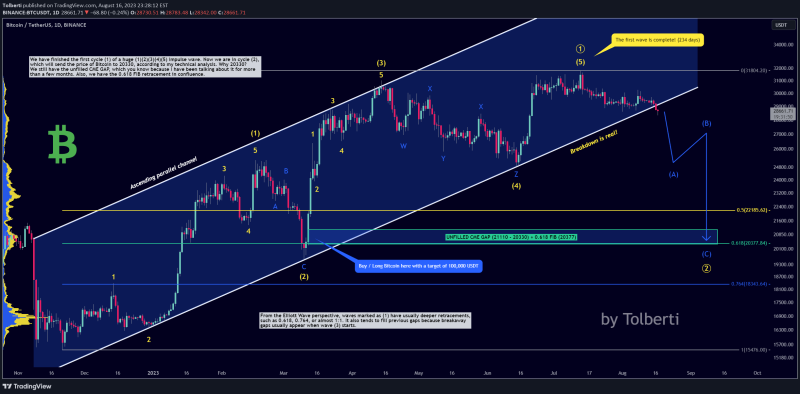
- The major uptrend from 15500 to 32000 is over, and the bears are stepping in! I expect 20330 to be hit in the next few weeks, so make sure you are prepared for it!
- We can clearly see that the major trendline / parallel channel is breaking down! The price is below the trendline, and what’s more, if we take a look at altcoins such as ETH, it confirms this analysis!
- We have finished the first cycle (1) of a huge (1)(2)(3)(4)(5) impulse wave. Now we are in cycle (2), which will send the price of Bitcoin to 20330, according to my technical analysis. Why 20330? We still have the unfilled CME GAP, which you know because I have been talking about it for more than a few months. Also, we have the 0.618 FIB retracement in confluence.
- This analysis is not a trade setup; there is no stop-loss, entry point, profit target, expected duration of the trade, risk-to-reward ratio, or timing. I share my trades transparently and post trade setups privately.
- From the Elliott Wave perspective, waves marked as (1) have usually deeper retracements, such as 0.618, 0.764, or almost 1:1. It also tends to fill previous gaps because breakaway gaps usually appear when wave (3) starts.
- It took 234 days for wave (1) to be completed. Compared to the stock market or gold, Bitcoin is struggling this year. Gains were overall pretty low.
- Bitcoin has been going sideways for a long time, and the direction is unclear. The volatility index on Bitcoin is at extreme lows, so a big move is expected! A big pump at the current price doesn’t make too much sense. But a big dump is definitely on the table.
- Let me know what you think about BTC in the comment section!
- Thank you, and for more ideas, hit “Like” and “Follow”!
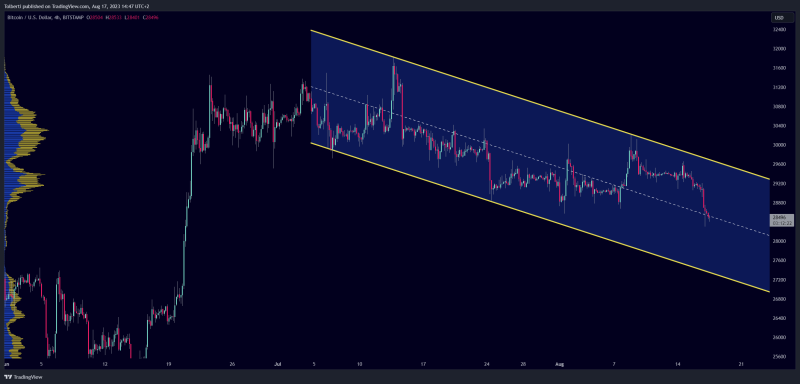
Comment: New parallel channel on the current downtrend; consider trading on the touch of the trendline.


