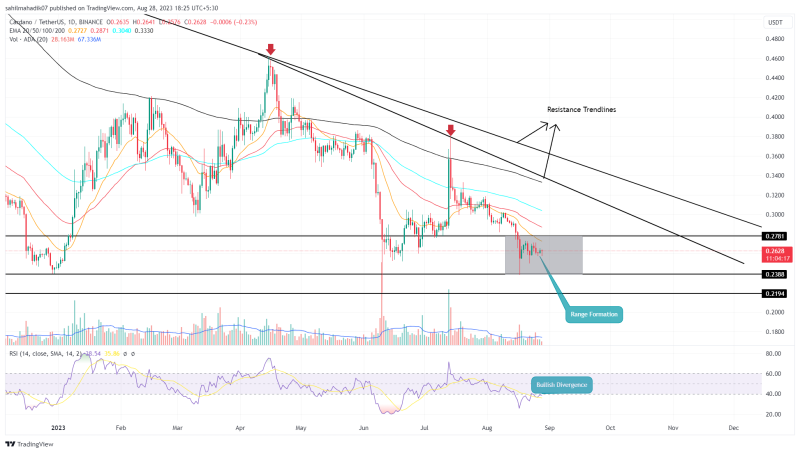
In response to rising bearishness in the crypto market, the ADA price painted a massive red candle on August 17th, which reached a low of $0.238 mark. However, after the significant drop, the price went entirely sideways trading inside the range of the aforementioned daily candle. While this range could be marked as a no-trading zone, its boundaries can be used to foretell the potential price trend.
Also Read: Binance Removes Cardano, MATIC, Pepe Coin, BTC & 35 Other Liquidity Pools, What It Means?
Cardano Daily Chart: Key Points
- The ADA price resonating in a narrow range creates a rectangular pattern in the daily chart.
- A bullish breakout from the $0.278 barrier may the coin price by 15%
- The intraday trading volume in the ADA coin is $146.5 Million, indicating an 8.7% gain
Source- Tradingview
For nearly two weeks, the Cardano price has been trading sideways reflecting initiation from buyers or sellers to regain trend control. As this consolidation may not produce significant candles to predict future trends, it increases the importance of the August 17th candle that enveloped the sideways trend,
Therefore, the daily chart creates a range between the two horizontal levels of $0.278 and $0.238. By press time, the ADA price trades at $0.262 and may continue to a sideways trend until the range pattern is intact.
Anyhow, if the bullish pressure in the market rises, the coin buyers may breach the $0.278 barrier, to obtain a launchpad that could push the relief rally 15% and hit the overhead trendline at $0.32.

1 ADA to USD = $0.2659275 1.26% (24h) Buy / Sell


Buy Crypto on an easy to use platform
Invest in leading cryptocurrencies such as Bitcoin, Ethereum, Cardano and more…

ADA

USD
Will Cardano Coin Fall Back to $0.22?
Amid the increasing uncertainty in the leading cryptocurrency Bitcoin, the major altcoin continues to witness overhead supply pressure. If the ADA price gives a breakdown below $0.238 support, the sellers may pull the prices to the $0.22 mark.
Relative Strength Index: Despite a sideways action, the daily RSI slope shows an evident rise indicating the increasing buying pressure at the bottom supports
Exponential Moving Average: Each downsloping EMA (20, 50, 100, and 200) can act as a significant resistance against a bullish recovery.


